Linux 查看内存(free buffer cache)
包含了三个部分:
第一个部分:
Linux下如何查内存信息,如内存总量、已使用量、可使用量。
经常使用Windows操作系统的朋友,已经习惯了如果空闲的内存较多,心里比较踏实。
当使用Linux时,可能觉的Linux物理内存很快被用光(如频繁存取文件后),当程序结束后内存没有被释放。空闲内存少的可怜,心里总不踏实。
Linux操作系统的内存管理方式与Windows不同,Linxu会尽量多的利用内存,让尽可能多的内存参与工作(做cache)以提高性能。
所以你看到的空闲内存总是很小,当你的程序需要更多内存时,Linxu系统会把做cache的内存还给你,让你来运行你的程序。
图1
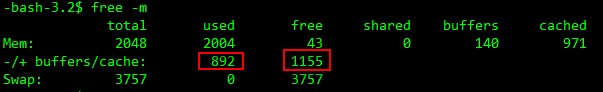
free -m :查看内存情况,单位为MB。
total 内存总数
used 已经使用的内存数(我的程序使用内存数量+系统缓存使用的内数量)
free 空闲的物理内存数(是真正的空闲,未被任何程序占用)
shared 多个进程共享的内存总额
buffers 磁盘缓存(Buffer Cache)的大小(可提高系统I/O调用的性能)
cached 磁盘缓存(Page Cache)的大小(可提高系统I/O调用的性能)
-buffers/cache 表示已被我们的程序使用的内存数,计算方法:used – buffers – cached
+buffers/cache 表示还可已被我使用的内存数,计算方法:free + buffers + cached
操作系统目前可用内存总量=free + buffers + cached,上图是1155M
buffers是用来给块设备做的缓冲大小、buffers是用来存储目录里面有什么内容,权限等等
cached用来给文件做缓冲,用来记忆我们打开的文件.
即使你的程序运行结束后,Cache Memory也不会自动释放。
这就会导致你在Linux系统中程序频繁读写文件后,你会发现可用物理内存(free)会很少。
其实这缓存内存(Cache Memory)在你需要使用内存的时候会自动释放,所以你不必担心没有内存可用。
如果你希望手动去释放Cache Memory也是有办法的。
手动释放缓存
—————————————
/proc是一个虚拟文件系统,我们可以通过对它的读写操作做为与kernel实体间进行通信的一种手段。也就是说可以通过修改/proc中的文件,来对当前kernel的行为做出调整。那么我们可以通过调整/proc/sys/vm/drop_caches来释放内存。操作如下:
cat /proc/sys/vm/drop_caches 查看默认值
先手动执行sync命令,sync 命令将所有未写的系统缓冲区写到磁盘中,包含已修改的 i-node、已延迟的块 I/O 和读写映射文件。
# echo 3 > /proc/sys/vm/drop_caches
# cat /proc/sys/vm/drop_caches
3
将/proc/sys/vm/drop_caches值设为3
再来运行free命令。可以看出来有效的释放了buffer和cache。
有关/proc/sys/vm/drop_caches的用法在下面进行了说明:
/proc/sys/vm/drop_caches (since Linux 2.6.16)
Writing to this file causes the kernel to drop clean caches,dentries and inodes from memory, causing that memory to become free.
To free pagecache, use echo 1 > /proc/sys/vm/drop_caches;
to free dentries and inodes, use echo 2 > /proc/sys/vm/drop_caches;
to free pagecache, dentries and inodes, use echo 3 > /proc/sys/vm/drop_caches.
Because this is a non-destructive operation and dirty objects are not freeable, the user should run sync first
第二部分:
What is the difference between Buffers and Cached columns in /proc/meminfo output?
https://www.quora.com/What-is-the-difference-between-Buffers-and-Cached-columns-in-proc-meminfo-output
Short answer: Cached is the size of the page cache. Buffers is the size of in-memory block I/O buffers. Cached matters; Buffers is largely irrelevant.
Long answer: Cached is the size of the Linux page cache, minus the memoryin the swap cache, which is represented by SwapCached (thus the total page cache size is Cached + SwapCached). Linux performs all file I/O through the page cache. Writes are implemented as simply marking as dirty thecorresponding pages in the page cache; the flusher threads then periodically write back to disk any dirty pages. Reads are implemented by returning the data from the page cache; if the data is not yet in the cache, it is first populated. On a modern Linux system, Cached can easily be several gigabytes. It will shrink only in response to memory pressure. The system will purge the page cache along with swapping data out to disk to make available more memory as needed.
Buffers are in-memory block I/O buffers. They are relatively short-lived. Prior to Linux kernel version 2.4, Linux had separate page and buffer caches. Since 2.4, the page and buffer cache are unified and Buffers is raw disk blocks not represented in the page cache—i.e., not file data. The Buffers metric is thus of minimal importance. On most systems, Buffers is often only tens ofmegabytes.
第三部分:
free: Understanding Linux Memory Usage
http://www.linuxintheshell.org/2012/06/05/episode-008-free-understanding-linux-memory-usage/
The free command is a handy snapshot into your systems memory and how much of it is being used. In conjunction with other tools like top you can get begin to understand where your system resources are being utilized and weed out potential bottlenecks and bugs. But before jumping into the deep end in system analysis, you need to have a decent grasp on how the Linux kernel utilizes memory, or you initial observations may send you tearing through the interwebs looking for a solution to a problem that does not exist.
Invoked by itself free will show a standard output like this:

By default the values are reported in kilobytes. Depending on your version of free the following display options may be available:
- -b – view in bytes (–bytes)
- -k – view in kilobytes (default) (–kilo)
- -m – view in megabytes (–mega)
- -g – view in gigabytes (–giga)
- –tera – view in terabytes
- -h – view in human readable mode where values are “automatically scaled to the shortest three digit unit” (–human)
Depending on the age of your system, the last two options may not be available.
Displaying the above using the -h or human readable mode produces this:

A first glance at the first line might produce alarm! The system is reporting 1.5G of RAM with 1.4G being used leaving 74 megs of RAM available. The current spec of this system running the free command is an Arch install using Fluxbox as the Window Manager, running Chromium (to write this post) with 5 tabs open, the Gimp with three images, Xchat, and Thunderbird. Not a lot going on there so why is the system using 1.4 GB of RAM? I thought Linux was easy on memory, especially when using a light weight window manager?
If I kill a few of these processes off, specifcally: Thunderbird, a few terminal windows, an errant sflphone and sflphone daemon process running from an iax connection a few days ago I bring my usage down a bit:

I now bring my usage down to 854 Megabytes of RAM with 647 Megabytes free according to the first line. That is still a lot of memory for a few applications. Where is the vaunted low footprint Linux is supposed to offer?
Just looking at the first line of free is not a clear picture of memory usage that one expects because it does not take into account how the memory is being utilized, particularly the cache buffers. That is where the second line comes in. The second line details the amount of memory being utilized by programs and not by the buffer cache. Hence the “-/+” which shows the amount of memory being utilized minus the buffer cache and the amount of free memory with the amount utilized by the buffer cache returned.
So what exactly is buffer cache? Buffer cache is an area of free physical memory utilized by the kernel to store data that has been recently read from a disk and/or utilized by a program, or that is ready to be written to the disk. The logic behind this utilization of memory is that reading from disk is slow compared to reading from memory. So if a bit of data is read from the disk there is a pretty good chance that data might be used again in the near future. So instead of just losing the data to the bit bucket, the data is stored in memory. This retrieval is far faster from memory than having to access it from disk again.
The same principle holds for writing to a disk. If a program writes data to disk it may be more efficient to cache this write in the buffer cache and allow the program to continue on instead of waiting for the data to be physically written to the disk. The kernel will handle writing the information to disk and the program can continue with what it was doing.
The buffer cache is dynamically allocated by the kernel and if you observe a running system over a period of time you will see the cache grow and shrink. You may even observe it consume over 90% of your memory as in the first screen shot above and become alarmed at such low resources available. But without taking the second line into consideration, you are missing the full picture.
As applications consume more memory, the kernel will begin dumping out any data from the buffer cache on a least used basis returning the cache to be used by actual applications that need it. Thus for all intents and purposes you can consider the memory used by the buffer cache to be “free” as you would expect to see when looking at how much memory is free in your system. To the kernel, though, it is memory in use, but a block of memory that will be immediately available to a program should it be required.
That being said, it is important to note that as applications consume more RAM, the performance of your system will begin to degrade after a certain point. If over 90% of your system memory is actually being used by applications this reduces the amount of memory available to the buffer cache so the performance boost the buffer cache offered in the past may not be available as physical RAM becomes consumed. Again, you can observe this by paying particular attention to the “-/+ buffers/cache” line.
Having a better understanding of the cache buffers will shed light on the rest of the output of free. The last three columns of the first line indicate the amount of memory being “shared,” utilized by the “buffers,” and utilized by the “cache.” The shared column is obsolete and can be ignored. But if you add up the amount of buffers and cached memory utilization and subtract it from the used column, you should get a value close to what is reported as used memory in the “-/+ buffers/cache” line. Or add it to the free value to get the free value of the second line.
The Swap line (3rd line of output) shows the amount of swap space being used by the system. This should be the value of your swap partition(s).
There are a few more options to the free command to outline. The first is the -t or –total options which displays a fourth line totaling the sum of the first line and the swap line of free for total, used, and free. This value will be displayed in bytes by default or in the unit value you specified:
free -mt
This would display the amounts in megabytes.
There is the -o or –old which displays the information of free in the “old” mode which essentially removes the buffers/cache line.
The -s or –seconds switch will display the output of free and then continue to display the output of free every n seconds specified:
free -h -s5
This will display the output of free in human readable format every 5 seconds until killed by ctrl-c.
The -s can be used with the -c or –count options which will display the output of free for n iterations with n seconds between each iteration:
free -m -s5 -c10
The output of free will be displayed every 5 seconds for 10 iterations. After the 10th output of free control will be returned to the shell and free will no longer be called. The -c option must be used in conjunction with the -s options.
Finally there is the –si option which will show the values in the power of 1000 as opposed to 1024.
The free command is a window into the performance of your system, but understanding how memory is utilized by the Linux kernel is important to determine the health of your system. By focusing on the amount of used and free memory in the first line of free, and not taking into account the amount of memory being used by the cache buffers, you may be setting yourself up for unnecessary concern.